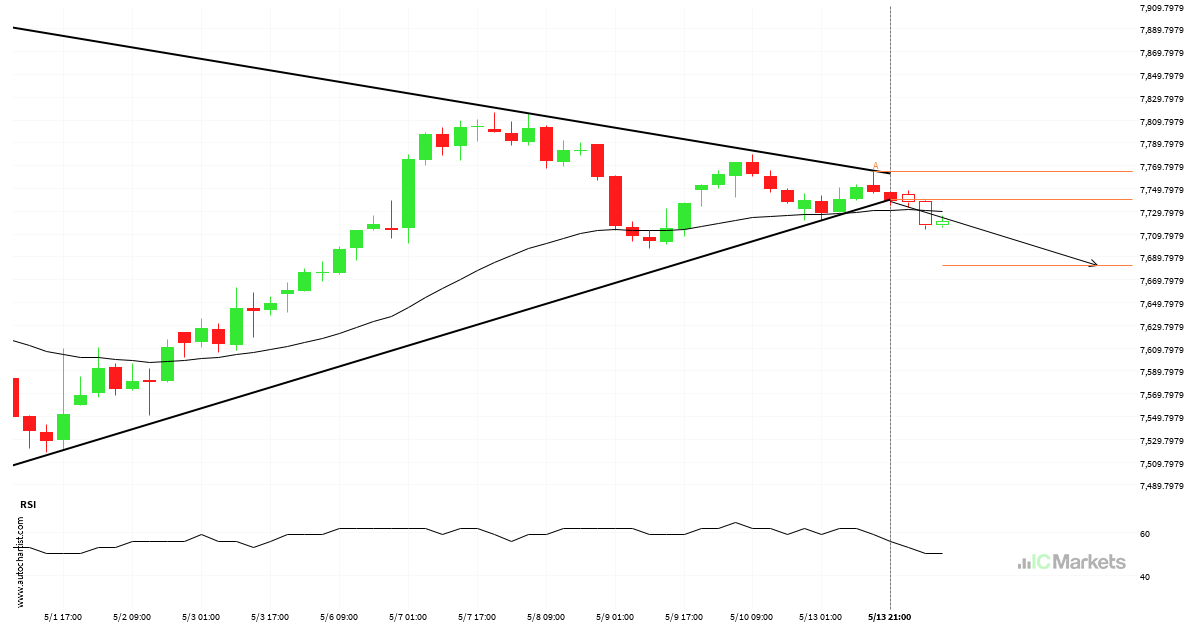
Australia 200 Index – support line breached
This trade setup on Australia 200 Index is formed by a period of consolidation; a period in which the price primarily moves sideways before choosing a new direction for the longer term. Because of the bearish breakout through support, it seems to suggest that we could see the next price move to 7682.2658.
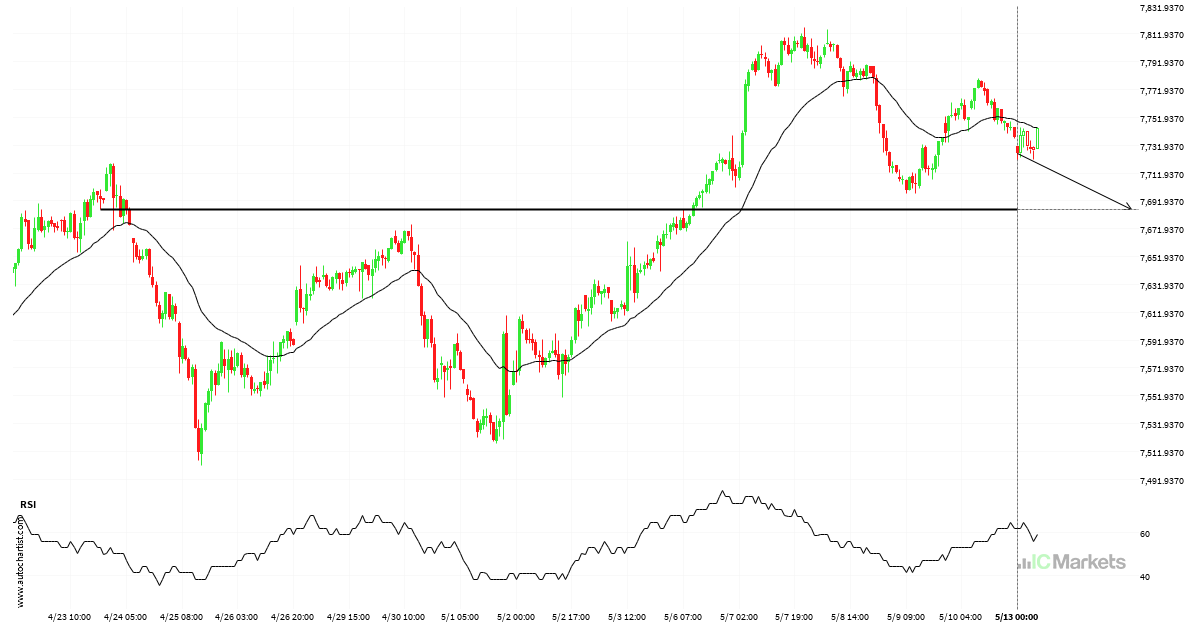
Australia 200 Index approaches important level of 7685.8701
Australia 200 Index is moving towards a key support level at 7685.8701. Australia 200 Index has previously tested this level 3 times and on each occasion it has bounced back off this level. Is this finally the time it will break through?
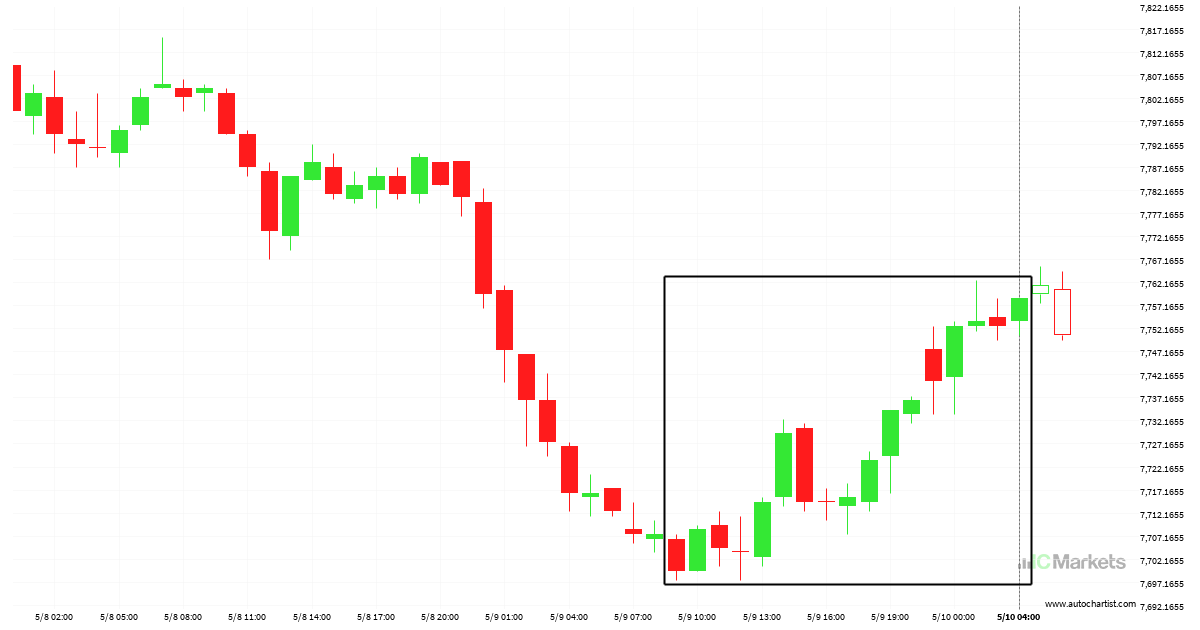
Extreme movement on Australia 200 Index
A movement of 0.77% over 19 hours on Australia 200 Index doesn’t go unnoticed. You may start considering where it’s heading next, a continuation of the current upward trend, or a reversal in the previous direction.
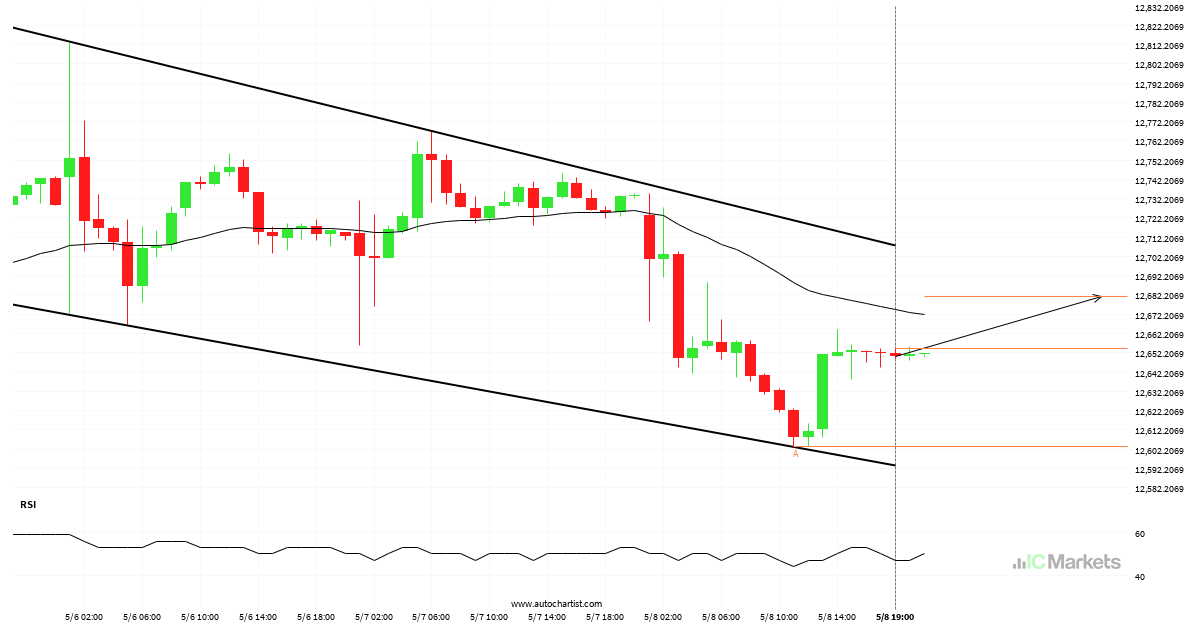
FTSE China A50 Index – Continuation Chart Pattern – Channel Down
FTSE China A50 Index is moving towards a resistance line. Because we have seen it retrace from this line before, we could see either a break through this line, or a rebound back to current levels. It has touched this line numerous times in the last 7 days and may test it again within the […]
Did you miss this move on Australia 200 Index?
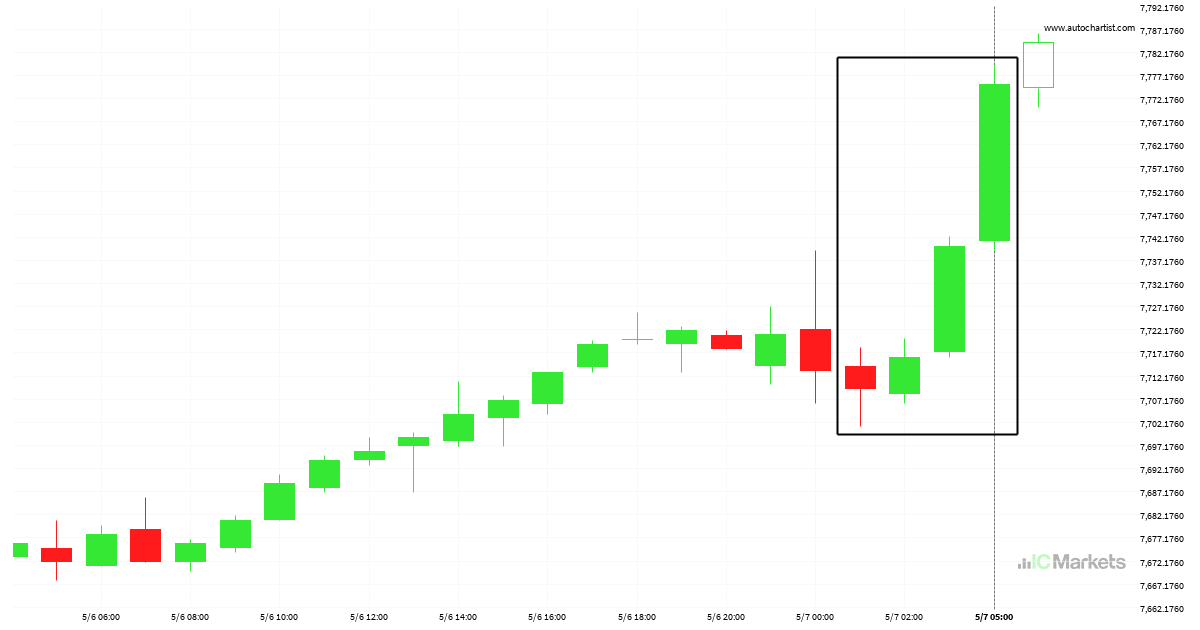
Those of you that are trend followers are probably eagerly watching Australia 200 Index to see if its latest 0.86% move continues. If not, the mean-reversion people out there will be delighted with this exceptionally large 4 hours move.
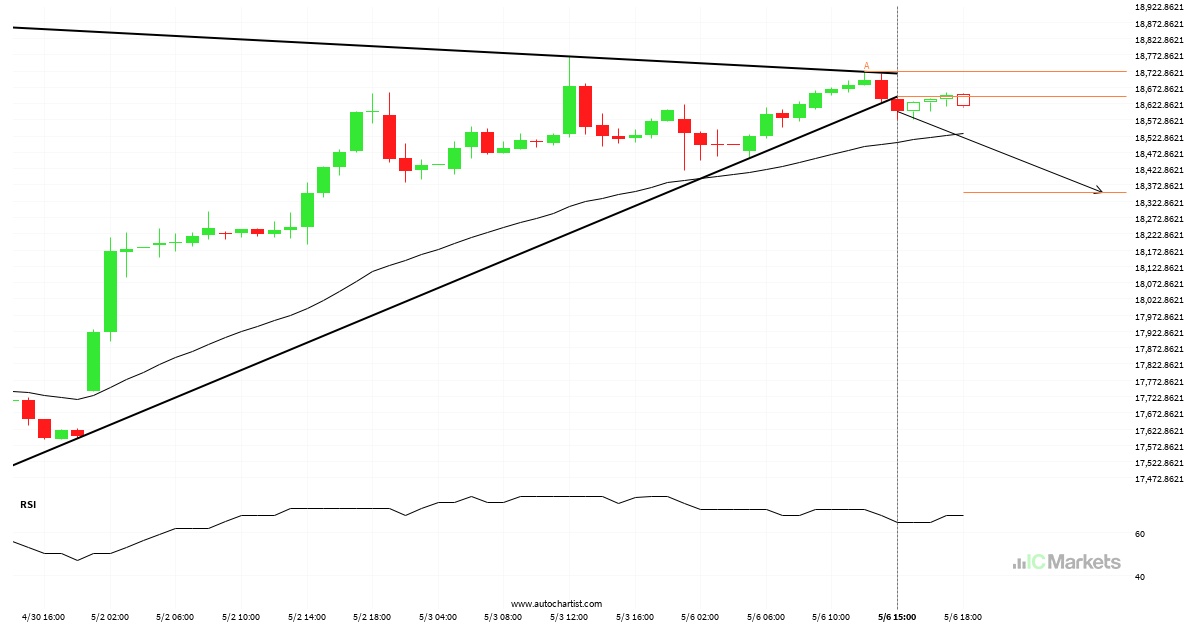
bearish technical pattern on Hong Kong 50 Index 1 hour
The breakout of Hong Kong 50 Index through the support line of a Triangle could be a sign of the road ahead. If this breakout persists, we may see the price of Hong Kong 50 Index testing 18348.8031 within the next 12 hours.
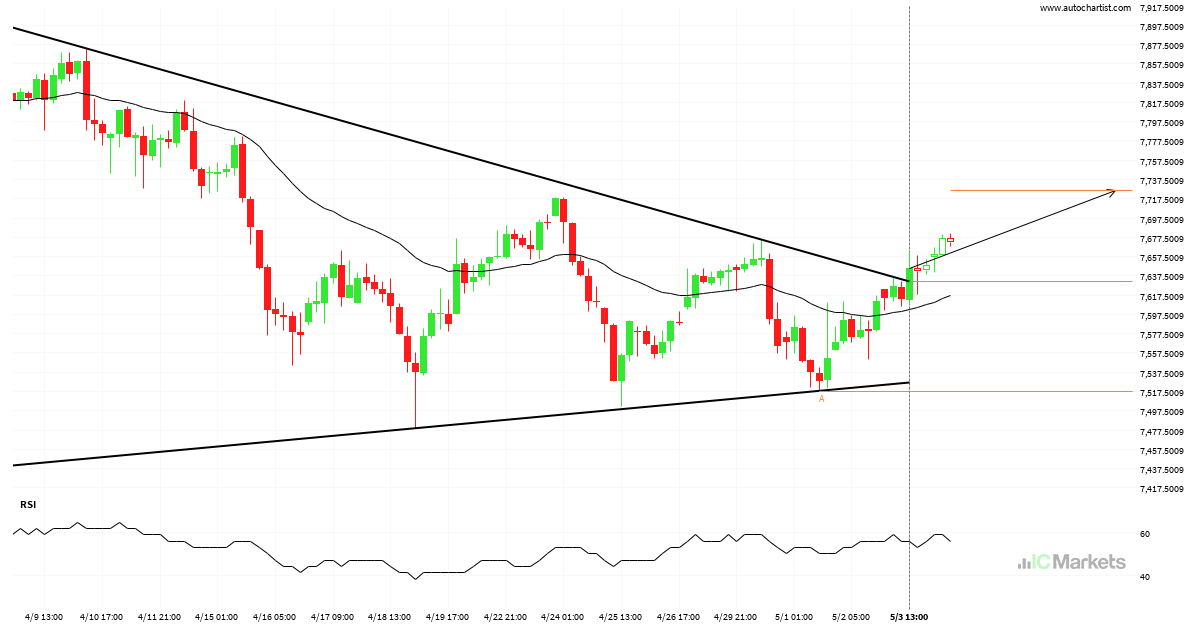
bullish technical pattern on Australia 200 Index 4 hour
Australia 200 Index has broken through a resistance line of a Triangle and suggests a possible movement to 7725.7632 within the next 3 days. It has tested this line in the past, so one should probably wait for a confirmation of this breakout before taking action. If the breakout doesn’t confirm, we could see a […]
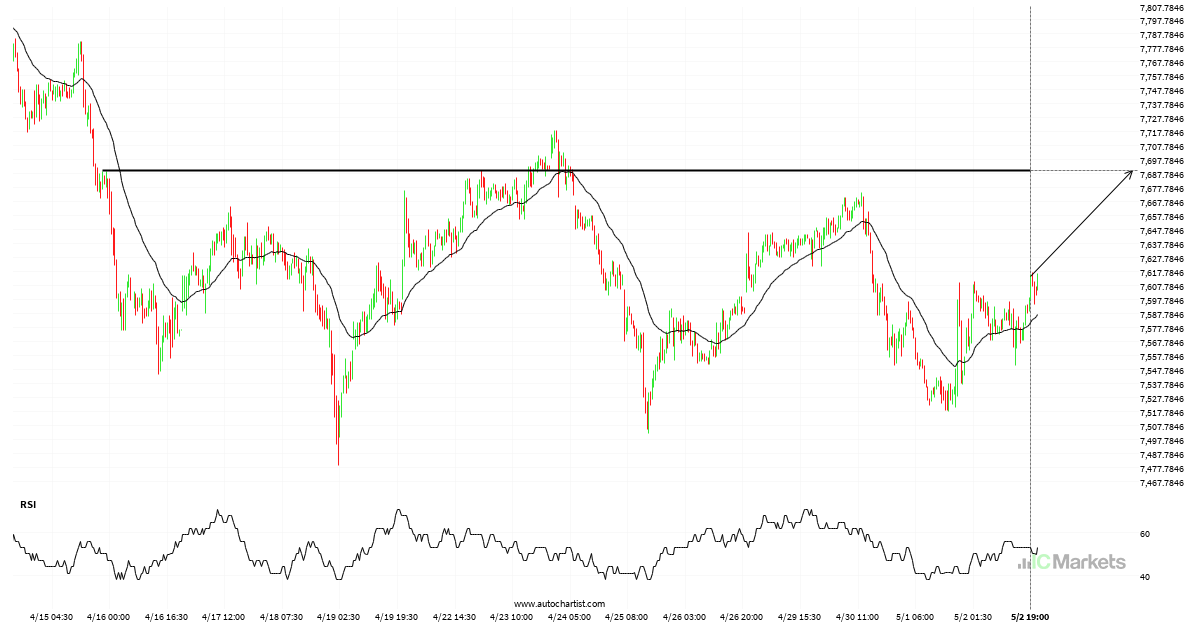
Australia 200 Index approaching resistance level
Australia 200 Index is moving towards a key resistance level at 7689.8701. Australia 200 Index has previously tested this level 3 times and on each occasion it has bounced back off this level. Is this finally the time it will break through?
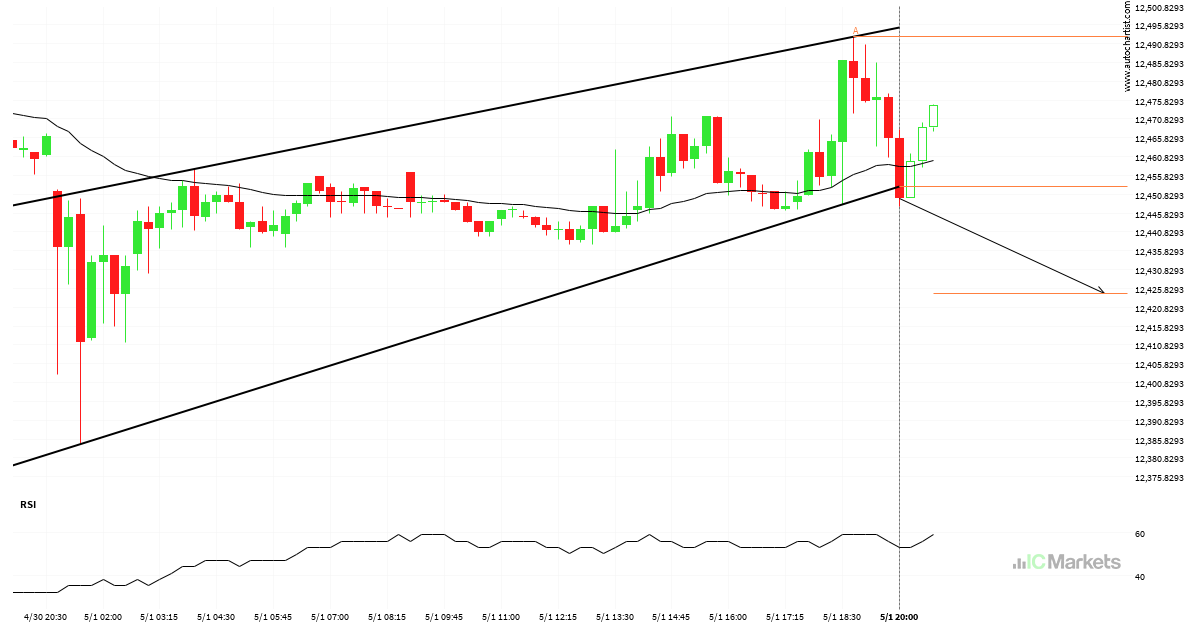
FTSE China A50 Index – support line breached
FTSE China A50 Index has broken through the support line of a Rising Wedge technical chart pattern. Because we have seen it retrace from this line in the past, one should wait for confirmation of the breakout before taking any action. It has touched this line twice in the last 2 days and suggests a […]
Huge bullish move on Australia 200 Index
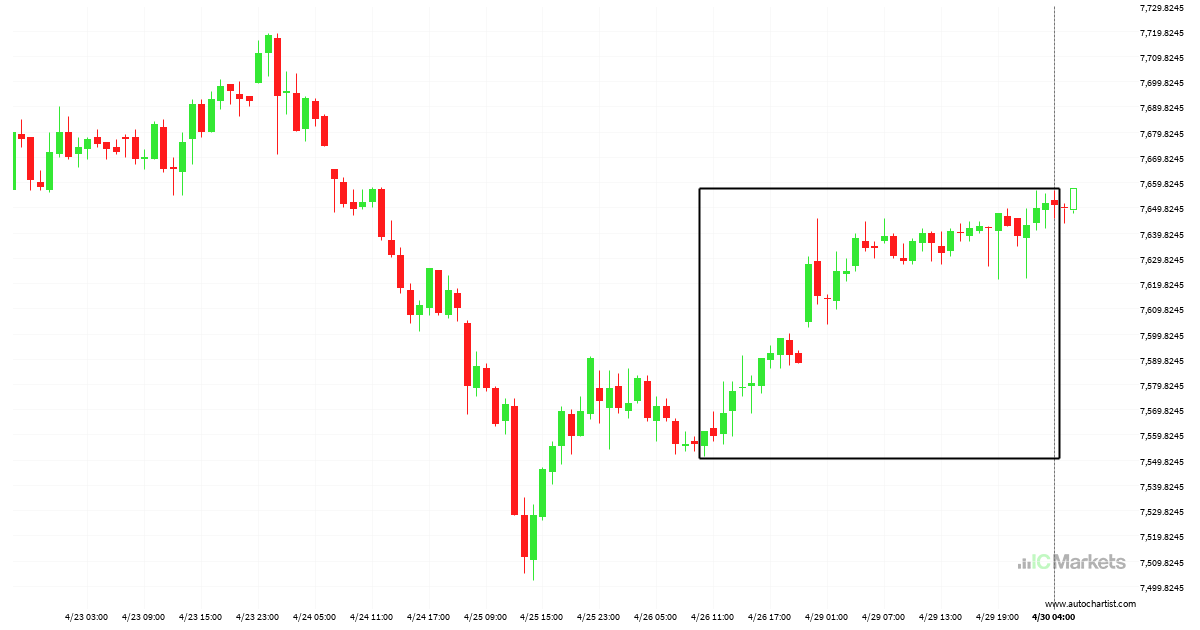
Australia 200 Index hits 7650.67 after a 1.18% move spanning 4 days.

